Williams %R
◙ Primary Use: Identifying Overbought/Oversold Market Levels
◙ Trading: Detecting Trend Continuation / Momentum Failures
◙ Standard Settings: 14 Periods
![]() Introduction to Williams %R
Introduction to Williams %R
Developed by Larry Williams, Williams %R is a momentum oscillator widely used for identifying overbought and oversold market conditions, as well as spotting momentum failures.
-
Williams %R oscillates between 0 and -100.
-
It measures the level of the closing price relative to the highest high over a specified period:
-
When Williams %R is near 0, it indicates the price is trading close to the highest high of the lookback period.
-
When Williams %R is near -100, it indicates the price is trading close to the lowest low of the lookback period.
-
-
The Stochastic Oscillator is similar, showing the closing price's level relative to the lowest low (see more under Stochastic Oscillator). (► more about the Stochastic)
-
Williams %R and the Fast Stochastic Oscillator yield the same values, differing only in their scaling.
![]() Calculating Williams %R
Calculating Williams %R
■ Williams % R = HC / HL * - 100
Where,
- HC = Highest High (in R Periods) – Last Closing Price
- HL = Highest High (in R Periods) – Lowest Low (in R Periods)

![]() Trading with Williams %R
Trading with Williams %R
Williams %R compares the closing price to the highest high over a set period and is helpful in:
-
Identifying overbought and oversold market conditions
-
Measuring trend momentum
-
Detecting momentum continuation or momentum failure
Note: Williams %R and the Fast Stochastic Oscillator provide the same readings, only with different scaling.
Overbought / Oversold Levels
-
0 to -20: Indicates overbought conditions in ranging markets. In trending markets, this may signal a short-term correction before the trend resumes.
-
-80 to -100: Indicates oversold conditions in ranging markets. In trending markets, this may also signal a short-term correction.
-
The midpoint level, -50, is often considered a key reference point.
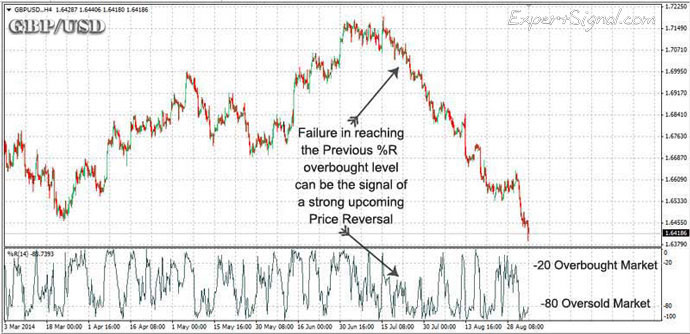
Momentum Failures
A momentum failure occurs when an asset that was previously overbought or oversold fails to return to its prior extremes. This may suggest a potential trend reversal or significant move in the opposite direction.
![]() Platform Setup
Platform Setup
To add Williams %R in MetaTrader 4 or 5, navigate to:
□ GO TO → INDICATORS → OSCILLATORS → WILLIAMS' PERCENT RANGE
□ STANDARD SETTINGS → 14
■ %R Larry Williams
ExpertSignal.com ©
Read More at ExpertSignal » MACD » RSI » CCI » ADX » DeMarker » Awesome » Gator
■ COMPARE PROVIDERS
► Forex Accounts
► Trade Signals
► Crypto Exchanges
► Volume indicators
►Trend Indicators
■ OSCILLATORS
» INTRODUCTION
» Momentum
» RSI PRECISION


")