Bollinger Bands (BB)
◙ Primary Use: Measuring Market Volatility | Spotting Oversold/Overbought Market Levels
◙ Trading: Identifying Trend Reversals (entry/exit triggers) | Recognizing trend strength and price compression
◙ Standard Settings: 20 Periods SMA and 2 Standard Deviations
![]() Introduction to Bollinger Bands
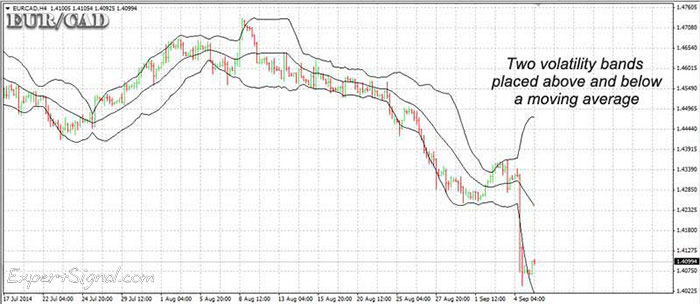
Introduction to Bollinger Bands
Created by renowned money manager and researcher John Bollinger, Bollinger Bands are a widely used technical indicator composed of three lines:
-
A middle band (20-day SMA)
-
An upper band: SMA + (2 × Standard Deviation)
-
A lower band: SMA − (2 × Standard Deviation)
These bands dynamically adjust to market volatility:
-
Wider bands = Increased volatility
-
Narrower bands = Decreased volatility
![]() Bollinger Bands Calculation
Bollinger Bands Calculation
Main Formulas:
-
Upper Band = 20-day SMA + (20-day Std Dev × 2)
-
Middle Band = 20-day SMA
-
Lower Band = 20-day SMA − (20-day Std Dev × 2)
%b Indicator
- Measures where price is relative to the bands.
Formula:
%b = (Price − Lower Band) / (Upper Band − Lower Band)
A %b value:
-
Near 1 = Overbought zone
-
Near 0 = Oversold zone

![]() Trading with Bollinger Bands
Trading with Bollinger Bands
These are the key use cases:
-
Spotting Trend Reversals
-
Historical entry/exit levels often align with band extremes
-
-
Pullback Detection
-
Intraday price dips toward the lower band can signal buying opportunities
-
-
Overbought/Oversold Conditions
-
Near Upper Band = Overbought
-
Near Lower Band = Oversold
-
-
Pattern Recognition
-
Helps validate patterns like:
-
Double Tops / Bottoms
-
Head and Shoulders
-
Breakouts & Failures
-
-
-
All Timeframes
-
Effective from 1-minute charts to multi-year trends
-
The Bollinger Band “Squeeze”
A Squeeze occurs when bands converge tightly around the moving average.
-
Indicates low volatility
-
Often precedes strong breakouts
-
Highly valuable in forex trading
A sudden expansion after a squeeze often reveals the next directional move.
![]() Platform Setup (MetaTrader 4/5)
Platform Setup (MetaTrader 4/5)
To install Bollinger Bands:
→ INDICATORS → TREND → BOLLINGER BANDS
Recommended Settings:
-
Normal: 20-Period SMA, 2 Standard Deviations
-
Short-Term: 10-Period SMA, 1.9 Std Dev
-
Long-Term: 50-Period SMA, 2.1 Std Dev
ℹ️ What is Standard Deviation? A statistical measure of price dispersion—larger deviations reflect higher volatility. (More about Standard Deviation)
Adjusting the Periods (Optional Settings)
| Trading Style | SMA Period | Standard Deviation |
|---|---|---|
| Standard (Default) | 20 | 2.0 |
| Short-Term Trading | 10 | 1.9 |
| Long-Term Trading | 50 | 2.1 |
Adjust based on your asset's volatility and trading horizon.
■ What are the Bollinger Bands?
ExpertSignal.com (c)
Read More at ExpertSignal » Ichimoku
■ COMPARE PROVIDERS
► Forex Accounts
► Trade Signals
► Crypto Exchanges
► Volume indicators
► Oscillators
■ TREND INDICATORS
» Introduction
» Moving Averages
» Fibonacci


