Estimating Bitcoin’s Fair Market Value
Estimating the fair market value of Bitcoin is challenging, as it is not backed by physical assets or traditional fundamentals. However, several metrics based on network activity and historical price trends can provide insights into Bitcoin’s market cycles. This analysis explores the following key metrics:
- Hashrate
- Bitcoin Net Unrealized Profit/Loss
- MVRV & MVRV-Z Score
- BTC Addresses with Balance ≥ $1M USD
- Bitcoin Miner's Rolling Inventory (MRI)
- Mayer Multiple
- Stock to Flow (S2F) Model
- A Strategic Approach to Bitcoin's Valuation
Hashrate and Its Impact on Bitcoin’s Fair Value
The higher the hashing power of the Bitcoin network, the stronger its security and resistance to potential attacks. Bitcoin’s hashrate is measured in hashes per second (H/s) and is influenced by mining difficulty and the average time between blocks.
Here are some key conclusions about the impact of hashrate:
-
Increased Bitcoin mining activity leads to a higher hashrate
-
As network difficulty rises, so does the hashrate
-
A higher hashrate means a more secure Bitcoin network
-
A stronger hashrate typically suggests a higher “fair” value for BTC
» https://www.blockchain.com/charts/hash-rate
Bitcoin Net Unrealized Profit/Loss (NUPL)
Net Unrealized Profit/Loss is a metric derived from the difference between Relative Unrealized Profit and Relative Unrealized Loss. It can also be calculated as:
‘Net Unrealized Profit/Loss’ is a metric based on the difference between Relative Unrealized Profit and Relative Unrealized Loss. It can also be calculated by subtracting the realized cap from the total market cap and dividing the result by the total market cap.
- (Market Cap — Realized Cap) / Market Cap
This metric measures how much of Bitcoin’s circulating supply is currently in profit or loss—and by how much. It is especially useful for estimating whether the Bitcoin market is approaching a top or a bottom.
Furthermore, NUPL can provide long-term trading signals:
-
Sell Signal: The market peaks when unrealized profits reach a high point while unrealized losses hit a low point.
-
Buy Signal: The market bottoms when unrealized profits reach a low point and unrealized losses peak.
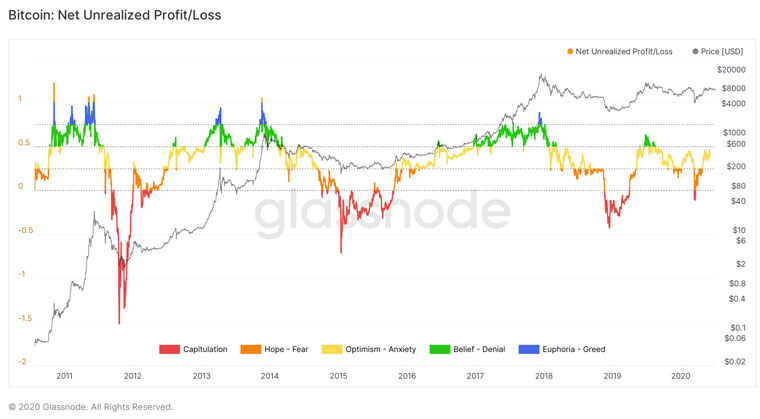
Chart: Bitcoin Net Unrealized Profit/Loss

The chart above from Glassnode summarizes Bitcoin’s unrealized profits and losses on a single line:
-
Whenever the Unrealized Profit/Loss line exceeds 0.75, the BTC market is considered highly overbought.
-
Whenever the Unrealized Profit/Loss drops below 0.00 (negative), the BTC market is oversold, and if it falls below -0.25, the market is highly oversold.
» https://studio.glassnode.com/metrics?a=BTC&m=indicators.NetUnrealizedProfitLoss
MVRV
Introduced by Murad Mahmudov & David Puell, the MVRV measures BTC network valuation by comparing market cap and realized cap:
- MVRV = Market Cap / Realized Cap
The MVRV uses blockchain analysis to compare market value and realized value to identify overbought/oversold markets.
MVRV-Z Score
The MVRV-Z Score is a variation that was introduced by Awe & Wonder in 2018. The MVRV-z smooths MVRV results and offers a better view of Bitcoin's price cyclicity. MVRV-Z Score is calculated by dividing MVRV to the standard deviation of the market cap.
- MVRV-Z Score= (Market Cap - Realized Cap) / (Standard Deviation of Market Cap)
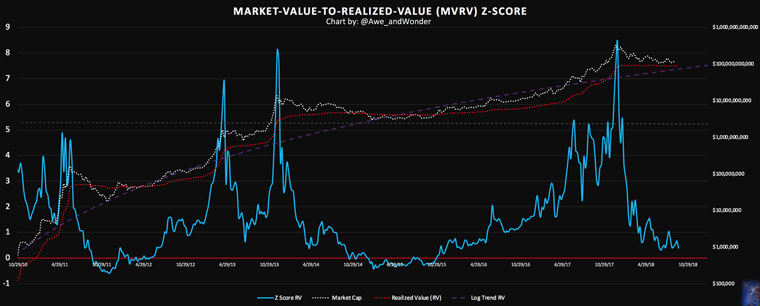
Chart: MVRV-Z

The MVRV-Z indicates if the BTC market value is significantly higher or lower than the realized value. Historically, it has indicated market tops and bottoms:
- Sell signal: MVRV-Z score is above 7
- Buy Signal: MVRV-Z score is close to 0, or negative
» https://charts.woobull.com/bitcoin-mvrv-ratio/
Bitcoin: Addresses with Balance ≥ $1M USD
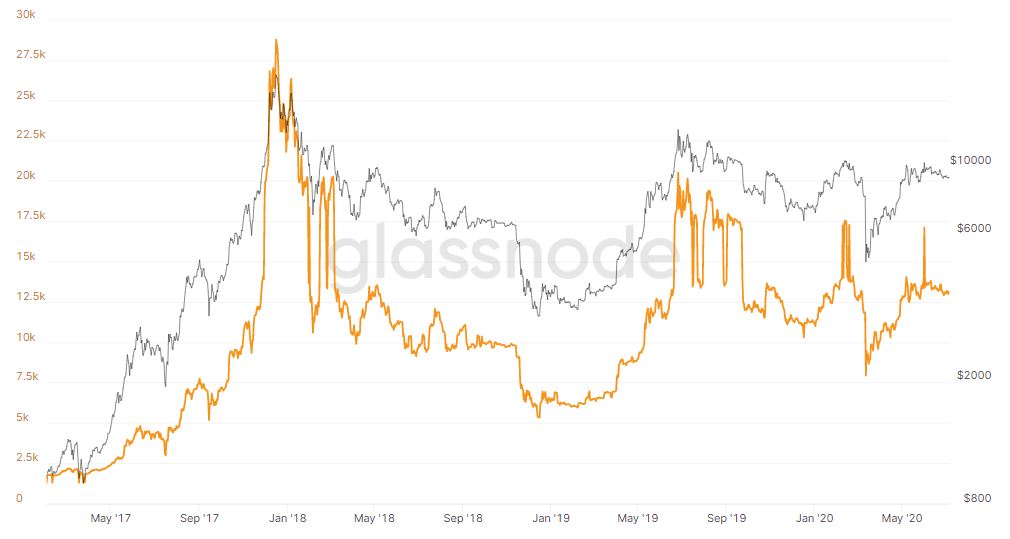
This metric from Glassnode measures the total number of unique addresses holding at least one million USD worth of Bitcoin. In other words, it shows how many Bitcoin millionaires currently exist.
Chart: Number of unique BTC addresses holding at least a value of $1M USD
In the above chart, we can see that there is a clear relationship between the BTC price and the number of BTC millionaires. However, we should treat any results with skepticism as:
- The exchange rate of BTC/USD is a major determinant of the number of addresses holding at least a value of 1 million USD
- Large investors tend to distribute their holdings in several addresses for risk-diversification purposes
» https://studio.glassnode.com/metrics?a=BTC&m=addresses.Min1MUsdCount
Bitcoin Miner's Rolling Inventory (MRI)
Miners play a vital role in influencing Bitcoin’s price. When a miner successfully solves a block, they receive a reward in BTC along with transaction fees. This reward consists of newly minted bitcoins that have never been spent before, known as new inventory. When these newly minted bitcoins are spent for the first time, it is recorded as a first-spend. The Miners’ Rolling Inventory metric tracks the amount of Bitcoin that miners currently hold as inventory.
Calculation:
- Bitcoin 1st Spend (3-6 weeks) / Bitcoin Mined (3-6 weeks)
Explanation:
-If MRI is above 100%, miners sell more than they mine and their BTC inventory is running down
-If MRI is exactly 100%, miners sell all the BTC they mine and their BTC inventory remains untouched
-If MRI is below 100%, miners sell less than they mine and their BTC inventory is increasing
The impact of MRI on Bitcoin price:
- According to ByteTree’s research (check below), a high MRI doesn’t put pressure on the price, it is reflective of a strong market bid that the miners are comfortable to sell into. And when that bid fades, the miners hold back and MRI falls. MRI is a useful tool for estimating BTC market health
- If the MRI reading is too low, then Bitcoin price may be in trouble in the future, as there is a growing Miner's inventory that will be eventually sold
» https://bytetree.com/insights/2020/02/bytetree-indicator
Introduced by Trace Mayer, the Mayer Multiple is a metric used to evaluate Bitcoin’s price relative to its historical trends. It is calculated as the ratio of the current Bitcoin price to its 200-day moving average.
- Mayer Multiple = BTC Price / 200 daily BTC moving average
The Mayer Multiple identifies historical areas where BTC becomes a tremendous investing opportunity (extremely low readings) or a speculative bubble (extremely high readings).
-The extreme lows of the Mayer Multiple indicate an oversold BTC market
-The extreme highs of the Mayer Multiple indicate an overbought BTC market
Observations:
- The extreme highs/lows Mayer Multiple indicate the potential of a strong long-term market reversal
- The average Mayer Multiple since the creation of Bitcoin is 1.36 (as for June 2020)
- Mayer Multiple above 1 is a general sign of a bull market (BTC price > 200 daily SMA), and below 1 is a general sign of a bear market
- The exact level 1 for the Mayer Multiple indicates strong support/resistance for the price of BTC (as the 200 days daily MA is one of the most significant BTC moving averages)
- According to Trace Mayer simulations, the best long-term BTC returns were achieved whenever the Mayer Multiple was below 2.4
In a historical context:
-Readings above 2.4 indicate an overbought BTC market
-Readings close to 0.50 indicate an extremely oversold BTC market
Introduced in 2019 by PlanB, the Stock-to-Flow (S2F) Model is one of the most widely discussed Bitcoin valuation models. The S2F model compares the production of new Bitcoins (flow) to the existing total supply (stock).
The model is based on the hypothesis that scarcity drives value, and scarcity is quantified by the Stock-to-Flow ratio:
- SF = stock / flow
Where:
-Stock is the size of the existing Bitcoin’s coins supply
-Flow is the yearly Bitcoin mined production (number of blocks per month)
A higher S2F ratio means increased scarcity and it indicates that an asset is a good store of value. In the long-term, an asset with a high S2F ratio should appreciate at price.
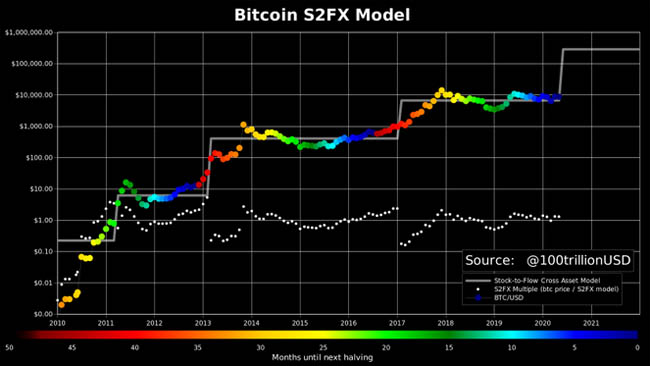
Chart: Bitcoin’s S2F Model (source: Plan-B)

Bitcoin halvings play a crucial role in the Stock-to-Flow model. Approximately every four years, the mining reward for adding a new Bitcoin block is cut in half, which effectively halves the supply of new BTC entering the market. It’s important to note that halvings are not set to specific calendar dates but are instead triggered by block height — occurring every 210,000 blocks, or roughly every four years.
- 2009, January - Starting Block Reward 50 BTC
- 2012, November Halving - New Block Reward 25 BTC
- 2016, July Halving - New Block Reward 12.5 BTC
- 2020, May Halving - New Block Reward 6.25 BTC
- 2024 Halving - New Block Reward 3.125 BTC
The S2F model is designed to smooth out the impact of Bitcoin halvings.
A Strategic Approach to BTC Valuation
Classic valuation models used for traditional assets such as equities and fiat currencies do not apply well to Bitcoin. BTC is a unique asset because:
-
There is a lack of ‘hard’ fundamental data
-
It has no fixed annual returns like dividends or interest
-
It is essentially a deflationary asset
-
The industry is still in an early stage with limited adoption
-
Bitcoin operates on a decentralized network, lacking centralized data collection
Despite these challenges, we can mentally construct a basic model for valuing Bitcoin by considering four major factors:
-
Technology — Current and future innovations, including necessity, scalability, and programmability
-
Adoption — The number of merchants, developers, and daily users supporting the network
-
Supply — Circulating and total supply of coins
-
Risk — Legislative, security, industry-related risks, and correlations with other asset classes
The following formula illustrates a general valuation framework for Bitcoin:
- BTC Valuation = (Technology * Adoption) / (Supply * Risk)
The supply curve of BTC is known, therefore, BTC value is based on new technological innovation, adoption, and risk.
Resources:
- Cryptocurrency Trading Guide: Fundamental & Technical Analysis for Cryptocurrency Thinkers -George M. Protonotarios (2019): https://www.amazon.com/Cryptocurrency-Trading-Guide-Fundamental-Technical-ebook/dp/B07TC4475G
- Bitcoin Net Unrealized Profit/Loss: https://medium.com/glassnode-insights/dissecting-bitcoins-unrealised-on-chain-profit-loss-73e735020c8d
- MVRV Score: https://medium.com/@Awe_andWonder/introducing-the-bitcoin-mvrv-z-score-metric-that-predicts-market-tops-with-90-accuracy-89d90df043d7
- S2F Model: https://medium.com/@100trillionUSD/modeling-bitcoins-value-with-scarcity-91fa0fc03e25
□ Bitcoin Valuation Models and Tools
G. Protonotarios for ExpertSignal.com (c)
MORE on ExpertSignal
■ COMPARE
► Crypto Accounts
■ LEARNING
» Cryptocurrency NFTs Guide
» RWA -Real World Asset Tokens
■ BITCOIN
» Bitcoin FAQ
■ EXCHANGES
► PrimeXBT
► ByBIT
► BitMex
► Gate IO


