Moving Average Convergence Divergence
(MACD)
◙ Primary Use: Trend-Following Momentum Indicator
◙ Trading: Trading Signals from MACD Crossovers | Slope Divergences (important)
◙ Standard Settings: 12-period Fast, 26-period Slow, and 9-period EMA
![]() Introduction to MACD (Moving Average Convergence Divergence)
Introduction to MACD (Moving Average Convergence Divergence)
Developed by Gerald Appel in the 1970s, MACD is a trend-following momentum indicator and one of the most widely used technical analysis tools worldwide. This oscillator can evaluate the momentum of a trend and generate reliable trading signals.
-
The MACD is the difference between a 26-day and a 12-day EMA (Exponential Moving Average).
-
The Signal Line is a 9-day EMA that acts as a trigger for buying or selling.
-
MACD can be used for trading any financial market (Forex, Equities, Commodities) across multiple timeframes.
There are two main ways to use MACD:
(a) A 2-line system (MACD and Signal Line) that focuses on their interaction.
(b) The MACD Histogram, which highlights crossovers above/below zero.
The MACD Histogram
Developed by Thomas Aspray, the MACD-Histogram shows the distance between the MACD line and the Signal Line.
-
MACD evaluates price action, while the Histogram shows what MACD is doing.
-
The MACD-Histogram can be used as a signaling tool around the zero line (crossing above/below zero indicates a crossover).
-
The higher the histogram value, the stronger the price momentum.
-
MACD-Histogram divergences can indicate an upcoming MACD line crossover.
![]() Calculating the Moving Average Convergence Divergence
Calculating the Moving Average Convergence Divergence
■ MACD Line = { Exponential Moving Average (12 periods) – Exponential Moving Average (26 periods) }
The MACD line is used as a measure of the convergence and the divergence of the fast and slow EMAs (Exponential moving averages)
■ Signal Line = { Exponential Moving Average (9 periods) of MACD Line }
The MACD signal line is used as an indicator of the directional change of the MACD line
■ MACD Histogram = MACD Line – Signal Line
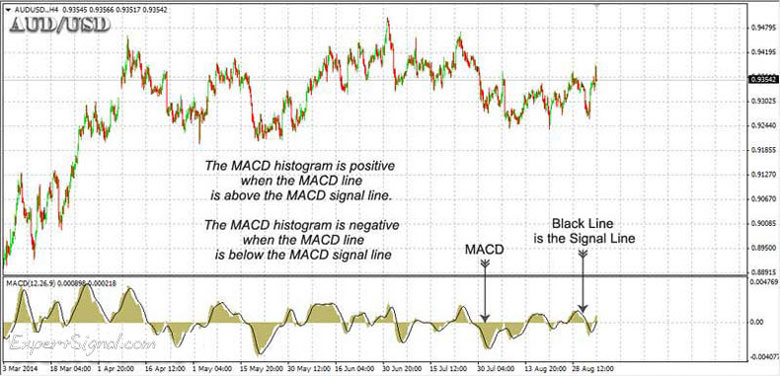
The MACD histogram reflects the difference between the MACD line and the MACD signal line:
- The MACD histogram is positive when the MACD line is above the MACD signal line
- The MACD histogram is negative when the MACD line is below the MACD signal line

![]() Trading with MACD
Trading with MACD
MACD uses 3 moving averages, enabling it to analyze price momentum effectively.
MACD can be used for:
-
Identifying the trend
-
Evaluating trend momentum
-
Trading signals from MACD crossovers
-
Divergences between price and MACD slopes
-
Contrarian trading strategies
Timeframes
MACD works across multiple timeframes, excluding very short ones. Suggested timeframes include:
-
M15, M30, H1, H4, and D1
-
MACD signals are more reliable on H1 and H4 charts.
Evaluating The Momentum of the Trend
-
When the two MACD lines move apart → momentum is increasing, and the trend strengthens.
-
When the lines move closer → momentum is decreasing, and the trend weakens.
Trading MACD Line Crossovers
This is the simplest way to trade MACD:
-
(↑) Buy when the MACD crosses above the Signal Line.
-
(↓) Sell when the MACD crosses below the Signal Line.
→ Using the Histogram, a crossover above/below the Signal Line happens at zero (0).
![]() Key Tips When Using MACD
Key Tips When Using MACD
These are some key tips when trading with the Moving Average Convergence Divergence:
-
Avoid using MACD on timeframes below M15.
-
The MACD Histogram is more beginner-friendly.
-
MACD may not generate reliable signals during very strong directional trends.
-
Divergence signals are more reliable than crossover signals.
-
Divergences work better on H1 and H4 (use lower timeframes for entries/exits).
-
Always confirm MACD signals using price action techniques:
-
Support/Resistance Breakouts
-
Channel Breakouts
-
Volume Breakouts (Equities)
-
Candlestick Formations (Find more here about candles)
-
RSI on lower timeframes (e.g., H1 MACD with M15 RSI)
-
-
In trending markets, the MACD lines will move away from each other, while in ranging markets, the two MACD lines will come close to each other
-
Alternative MACD settings include: 8 | 17.5 | 9
![]() Platform Setup
Platform Setup
You can install the 'MACD' or'MACD HISTOGRAM' directly in MetaTrader-4 or MetaTrader-5:
(i) CLASSIC (2-LINE) MACD SYSTEM
□ GO TO → INDICATORS → OSCILLATORS → MACD
□ STANDARD SETTINGS → 12,26,9
(ii) MACD HISTOGRAM
□ GO TO → INDICATORS → CUSTOM → MACD HISTOGRAM
□ STANDARD SETTINGS → 12,26,9
■ The Moving Average Convergence Divergence
George Protonotarios, financial analyst
ExpertSignal.com ©

Read More at ExpertSignal » MACD » RSI » CCI » ADX » DeMarker » Awesome » Gator
■ COMPARE PROVIDERS
► Forex Accounts
► Trade Signals
► Crypto Exchanges
► Volume indicators
►Trend Indicators
■ OSCILLATORS
» INTRODUCTION
» Momentum
» RSI PRECISION


")