- Details
- Technical Indicators
This article highlights some of the most important volume-based indicators in technical analysis. It covers both short- and long-term indicators used to analyze the volume behavior of specific assets or to evaluate the broader market.

Why Does Volume Analysis Matter?
Volume analysis is important because volume often precedes price and reveals the strength behind a market move. By combining volume with price, traders gain a more complete understanding of market dynamics. When using volume indicators, it is crucial to choose the appropriate timeframes and trading parameters.
-
Volume often leads price movements
-
Volume can confirm strong trends, breakouts, and trend reversals
-
Chart patterns typically have corresponding volume confirmation

- Details
- Trend Indicators
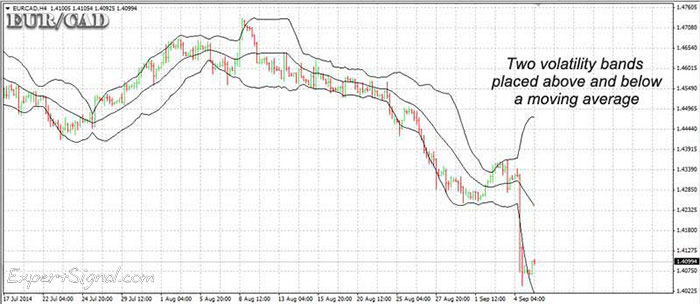
Bollinger Bands (BB)
◙ Primary Use: Measuring Market Volatility | Spotting Oversold/Overbought Market Levels
◙ Trading: Identifying Trend Reversals (entry/exit triggers) | Recognizing trend strength and price compression
◙ Standard Settings: 20 Periods SMA and 2 Standard Deviations
![]() Introduction to Bollinger Bands
Introduction to Bollinger Bands
Created by renowned money manager and researcher John Bollinger, Bollinger Bands are a widely used technical indicator composed of three lines:
-
A middle band (20-day SMA)
-
An upper band: SMA + (2 × Standard Deviation)
-
A lower band: SMA − (2 × Standard Deviation)
These bands dynamically adjust to market volatility:
-
Wider bands = Increased volatility
-
Narrower bands = Decreased volatility
- Details
- Trend Indicators

Trend Indicators in Technical Analysis (TA)
Trend indicators are technical analysis tools designed to identify the direction and strength of any market trend. These tools are helpful in confirming whether an asset is trending or ranging, allowing them to make better trading decisions.
Trending/Ranging Financial Markets
(i) Trending Market: When the price of a financial asset or market follows a specific trend over a long period of time.
(ii) Ranging Market: When the price of an asset or market moves up and down without following a specific long-term trend (trading within a range formed by an upper and a lower band).
Trend Indicators Are Reliable Only in Trending Markets
□ If a financial market is trending, trend indicators can provide highly reliable trading signals.
□ If a financial market is ranging, trend indicators may mislead traders. (In a ranging market, traders should instead use momentum indicators, which are better suited to identifying short-term price movements within the range.)
- Details
- Trend Indicators
Moving Averages (MAs)
◙ Primary Use: Evaluating Market Trends and Spotting Reversals
◙ Trading: Spotting trend reversals (MA Crossovers)
◙ Combination: Confirming trends when combined with other indicators (RSI, ADX)
◙ Standard Settings: 10-period, 21-period, 30-period, 50-period, 200-period MAs
![]() Introduction to Moving Averages
Introduction to Moving Averages
Moving Averages (MAs) are foundational tools in technical analysis, offering a simple yet effective way to smooth price data and filter out market noise. By comparing an asset’s price to its moving average—such as a 50-day MA—traders can quickly assess whether the asset is trending or potentially overbought/oversold.
Key Benefits of Using MAs in Trading
-
Smooth out market noise for clearer trend direction
-
Work across all timeframes and markets (stocks, forex, commodities, etc.)
-
Can serve as a confirmation tool when used with other indicators (e.g., RSI, ADX)
-
Often used in automated trading systems or combined into complex strategies
- Details
- Trend Indicators
Trading with the Ichimoku Kinko Hyo (一目均衡表)
◙ Primary Use: Evaluating the Trend | Identifying Overbought/Oversold Levels
◙ Trading with Ichimoku: Spotting Strong Trends and Reversals
◙ Standard Settings: Tenkan-Sen (9), Kijun-Sen (26), Senkou Span (52)
![]() Introduction to Ichimoku Kinko Hyo
Introduction to Ichimoku Kinko Hyo
Many Forex professionals consider the Ichimoku Kinko Hyo to be one of the best technical analysis tools for trading the Foreign Exchange Market. The Ichimoku Kinko Hyo was developed by the Japanese analyst Goichi Hosoda in the late 1960s. The indicator can be used in any financial market (Forex, stocks, etc.).
What distinguishes the Ichimoku Kinko Hyo from other indicators is its ability to provide a complete and quick picture of the current market conditions through the Quick Equilibrium Chart. Ichimoku Kinko Hyo can also identify strong trends and reversals at a glance.
Chart: Ichimoku Kinko Hyo on EUR/CAD

- Details
- Trend Indicators
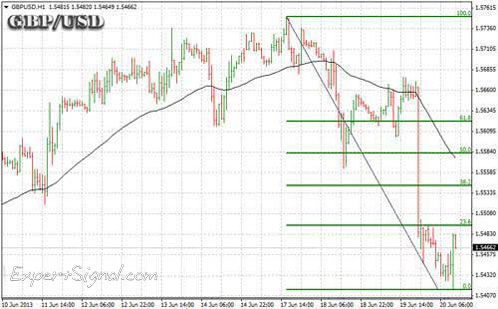
Fibonacci Numbers & Tools
◙ Primary Use: Identifying Trends and Spotting Reversals
◙ Trading with Fibonacci: Calculating Support & Resistance Levels
◙ Typical Levels: 0.236 | 0.382 | 0.500 | 0.618 | 1.000 | 1.618 | 2.618 | 4.236
![]() Introduction to the Fibonacci Sequence
Introduction to the Fibonacci Sequence
Leonardo Pisano, also known as Fibonacci, was a renowned 12th-century Italian mathematician who introduced a remarkable sequence of numbers—now called the Fibonacci sequence.
Book on Amazon: Trading World Markets Using Phi and the Fibonacci Numbers
This infinite sequence is defined by the rule:
General Formula:
-
X(n) = X(n-1) + X(n-2)
Example:
0 | 1 | 1 | 2 | 3 | 5 | 8 | 13 | 21 | 34 | 55 | 89 | 144 | 233 | ...
Where each number is the sum of the previous two (e.g., 5 = 2 + 3, 13 = 8 + 5).
Chart: Applying the Fibonacci Retracement tool to spot support and resistance levels
Trend Indicators
Defining Trend Indicators
Trend indicators are technical analysis tools that use price action to identify price patterns and the direction of the price trend (trend continuation or reversal)...
Oscillators
Defining Oscillators
Oscillators are technical analysis tools that bound within a predefined range. Oscillators are placed below the main chart area and not within the chart area as common indicators.


")